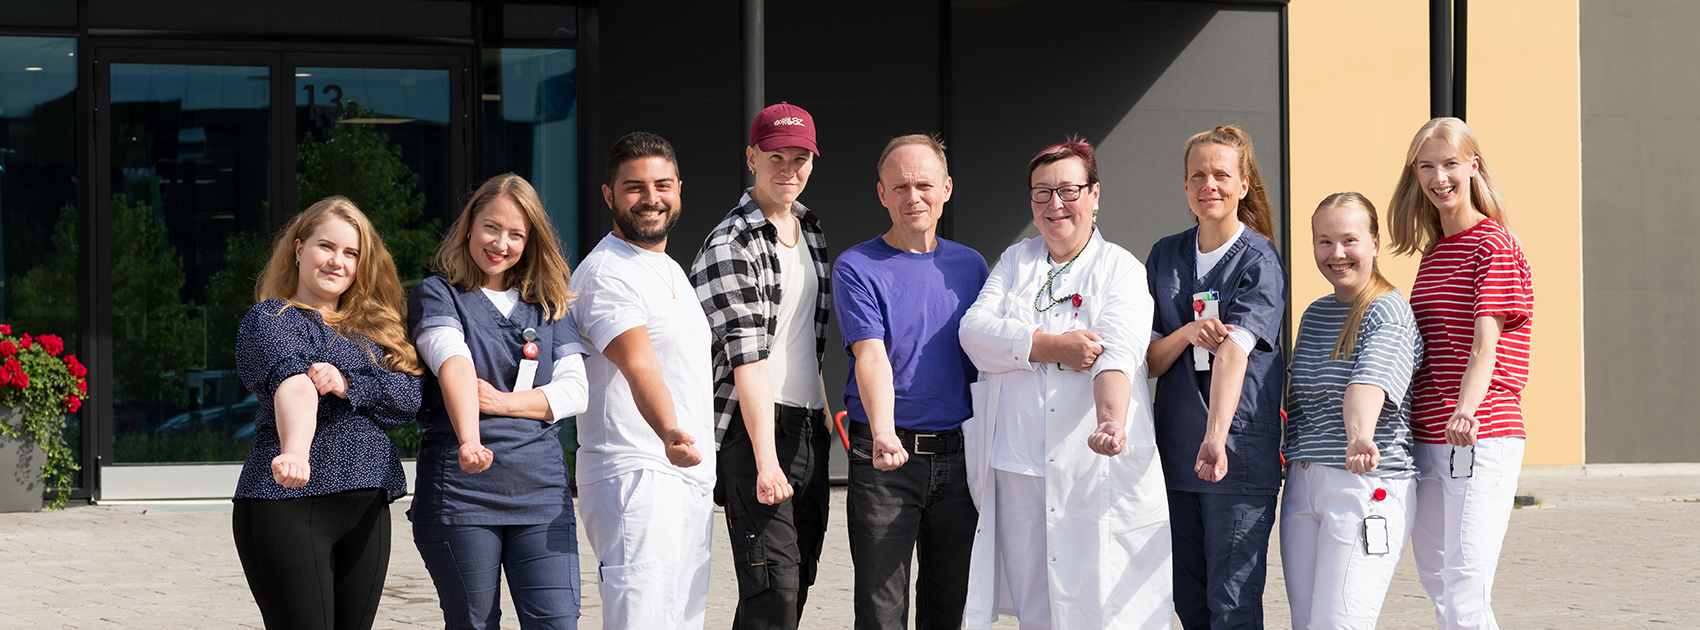
Staff
In 2024, the Blood Service had an average of 531 employees, whose contributions total the equivalent of 436 full-time employees (FTEs). The mean age of the personnel was 43 years. Of the personnel, 87% were female and 13% were male.
The staff survey showed that the well-being of the work community was still at an excellent level overall. The sickness leave percentage was 3.5 % of theoretical working hours. During 2024, the focus of developing the entire Blood Service work community was on improving well-being, particularly in terms of psychological stress, renewal and skills development, developing the operating culture, and promoting equality work.
Targeted group coaching and low-threshold appointments with a work psychologist were offered to support well-being. We continued to promote work ability by providing a wide range of well-being and exercise benefits, such as company bicycles and commuting incentives for those who come to work by bike or on foot. In 2024, this incentive was paid to 185 employees. The entire staff was involved in working on important common goals through strategic competence team workshops and culture discussions at the organizational level. We trained our supervisors on equality issues and updated our salary system.
Number of personnel, average
| 2023 | 2024 | |
|---|---|---|
| Total number of personnel, average | 529 | 531 |
| Number of personnel, full-time (FTE) | 442 | 436 |
| Full-time employment | 465 | 460 |
| Permanent | 414 | 421 |
| Temporary | 115 | 110 |
| Full-time | 373 | 362 |
| Part-time | 122 | 133 |
| On-call | 34 | 35 |
| Long absences | 30 | 35 |
Distribution of personnel in the organisation (%)
| Distribution of personnel in the organisation (%) | 2024 |
|---|---|
| Blood donation | 44 |
| Blood products | 17 |
| Medical Services and Quality Management | 19 |
| Research, product development and new services | 9 |
| Other units | 11 |
Sickness absences
| 2022 | 2023 | 2024 | |
|---|---|---|---|
| Short absences due to sickness and accidents (days/person) | 5.6 | 5.0 | 4,6 |
| Absences due to sickness and accidents, total (days/person) | 9.6 | 8.9 | 8,7 |
| Sickness absence rate (% of theoretical working time) | 3.8 % | 3.5 % | 3,5 % |